Story Highlights
- 17% in U.S. satisfied with direction of country, 85% with personal life
- Weekly churchgoers, college graduates, wealthier more satisfied with life
- 30% of Democrats, 4% of Republicans satisfied with U.S. direction
WASHINGTON, D.C. -- Amid the ongoing COVID-19 pandemic and record-high inflation, Americans' satisfaction with the direction of the country has fallen to 17%, the lowest in a year. At the same time, Americans' satisfaction with their own lives has ticked up to 85%, just five points shy of the 2020 record-high point.
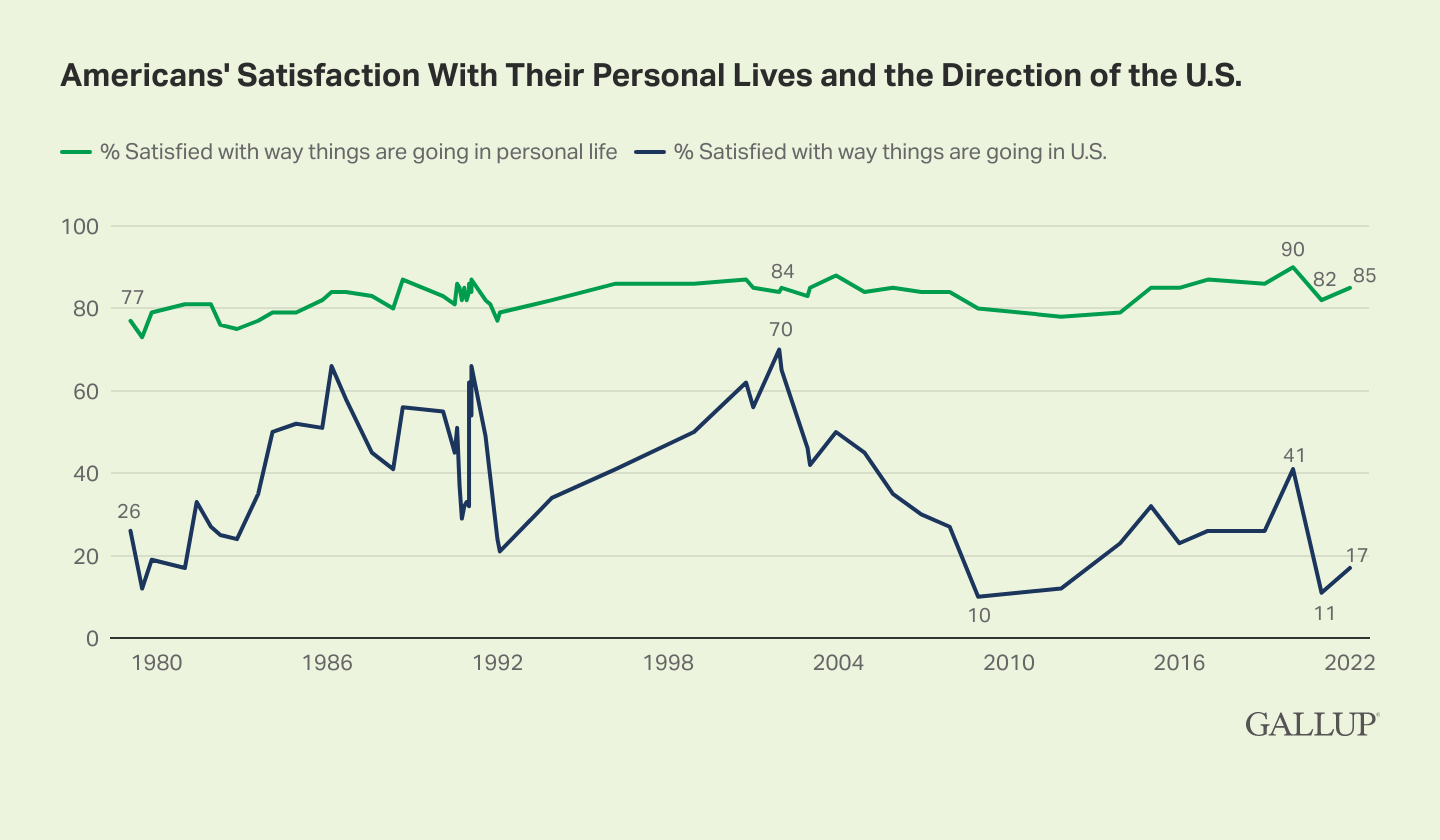
Line graph. Americans' satisfaction with the way things are going in their personal lives and the way things are going in the U.S. since 1979. Personal satisfaction has been consistently and significantly higher than national satisfaction since 1979. Currently, 85% of U.S. adults say they are satisfied with their personal life, and 17% are satisfied with the way things are going in the U.S. The 68-percentage-point gap in these two readings is second only in magnitude to last year's 71-percentage-point gap.
Personal satisfaction has been consistently and significantly higher than national satisfaction since 1979 when Gallup first tracked these two measures. But that divergence is near the record high as today's 68-percentage-point gap between the two, from the Jan. 3-16 Mood of the Nation poll, is second only to last year's 71-point gulf.
More generally, national satisfaction has exhibited far greater variation than personal satisfaction over the years. While personal satisfaction has ranged from 73% to 90% in Gallup's periodic measures since 1979, national satisfaction, which Gallup now tracks monthly, has fluctuated between the record-high 71% in 1999 and the low of 10% recorded during the Great Recession in 2008.
The current 17% national satisfaction reading is the lowest of Joe Biden's first year in office and coincides with his lowest job approval rating, 18% congressional job approval, sagging economic confidence and the expectation that inflation will rise in the coming months. Still, national satisfaction remains slightly above the 11% reading measured shortly after protesters violently stormed the U.S. Capitol on Jan. 6, 2021.
Degrees of Satisfaction Shifted Between 2020 and 2022 on Both Measures
In addition to tracking overall satisfaction on both personal and national levels, Gallup has asked Americans periodically since 2001 how strongly satisfied or dissatisfied they are. The recent trends show that the public's personal and public moods remain subdued after sinking in the first year of the pandemic.
Two years ago, before the COVID-19 pandemic took hold of the nation, a record high 65% of U.S. adults said they were "very satisfied" with their own lives. Last year, the pandemic-weary public's high personal satisfaction rating fell to 51%, and it remains at that level today. Another 34% are currently somewhat satisfied.
Even as satisfaction with the way things were going in the nation in January 2020 was a relatively high 41%, a 58% majority of Americans were dissatisfied, including 33% who were very dissatisfied. By January 2021, the percentage saying they were very dissatisfied had doubled to 66%. This year, it has fallen back to 51%, with another 31% saying they are somewhat dissatisfied.
| 2020 | 2021 | 2022 | |
|---|---|---|---|
| % | % | % | |
| Personal life | |||
| Very satisfied | 65 | 51 | 51 |
| Somewhat satisfied | 25 | 31 | 34 |
| Somewhat dissatisfied | 6 | 11 | 10 |
| Very dissatisfied | 4 | 7 | 4 |
| U.S. direction | |||
| Very satisfied | 17 | 3 | 4 |
| Somewhat satisfied | 24 | 8 | 13 |
| Somewhat dissatisfied | 25 | 22 | 31 |
| Very dissatisfied | 33 | 66 | 51 |
| gallup | |||
Life Satisfaction Influenced by Education Level, Income and Churchgoing
Life satisfaction levels vary the most by three demographic attributes -- education level, annual household income and religious service attendance.
Majorities of Americans who attend religious services weekly (67%), have household incomes of $40,000 to $99,999 (52%) or $100,000 or more (61%), or earned college degrees (54%) are very satisfied with their own lives. Meanwhile, less than half of their counterparts express the highest level of satisfaction, though majorities still say they are very or somewhat satisfied.
| Very satisfied | Somewhat satisfied | Somewhat dissatisfied | Very dissatisfied | |
|---|---|---|---|---|
| % | % | % | % | |
| Religious service attendance | ||||
| Weekly | 67 | 25 | 5 | 1 |
| Nearly weekly/monthly | 44 | 43 | 10 | 3 |
| Less often | 48 | 34 | 12 | 6 |
| Annual household income | ||||
| $100,000+ | 61 | 33 | 5 | 1 |
| $40,000-$99,999 | 52 | 35 | 10 | 3 |
| Less than $40,000 | 39 | 36 | 13 | 9 |
| Education | ||||
| College graduate | 54 | 37 | 7 | 2 |
| Not college graduate | 49 | 32 | 12 | 5 |
| gallup | ||||
Party Identification Is Greatest Driver of National Satisfaction
While Americans' satisfaction with their personal life does not vary significantly among partisans, party identification largely affects how things are going in the U.S. That is, partisans are more likely to say they are satisfied when the president's party matches their own. Most recently, Republicans' satisfaction outpaced Democrats' during Donald Trump's presidency, but once Biden took office, Democrats became more satisfied than Republicans with the nation's direction.
Still, satisfaction is muted among all partisans, with 30% of Democrats, 15% of independents and 4% of Republicans currently satisfied. Majorities of Republicans (72%) and independents (54%) are very dissatisfied.
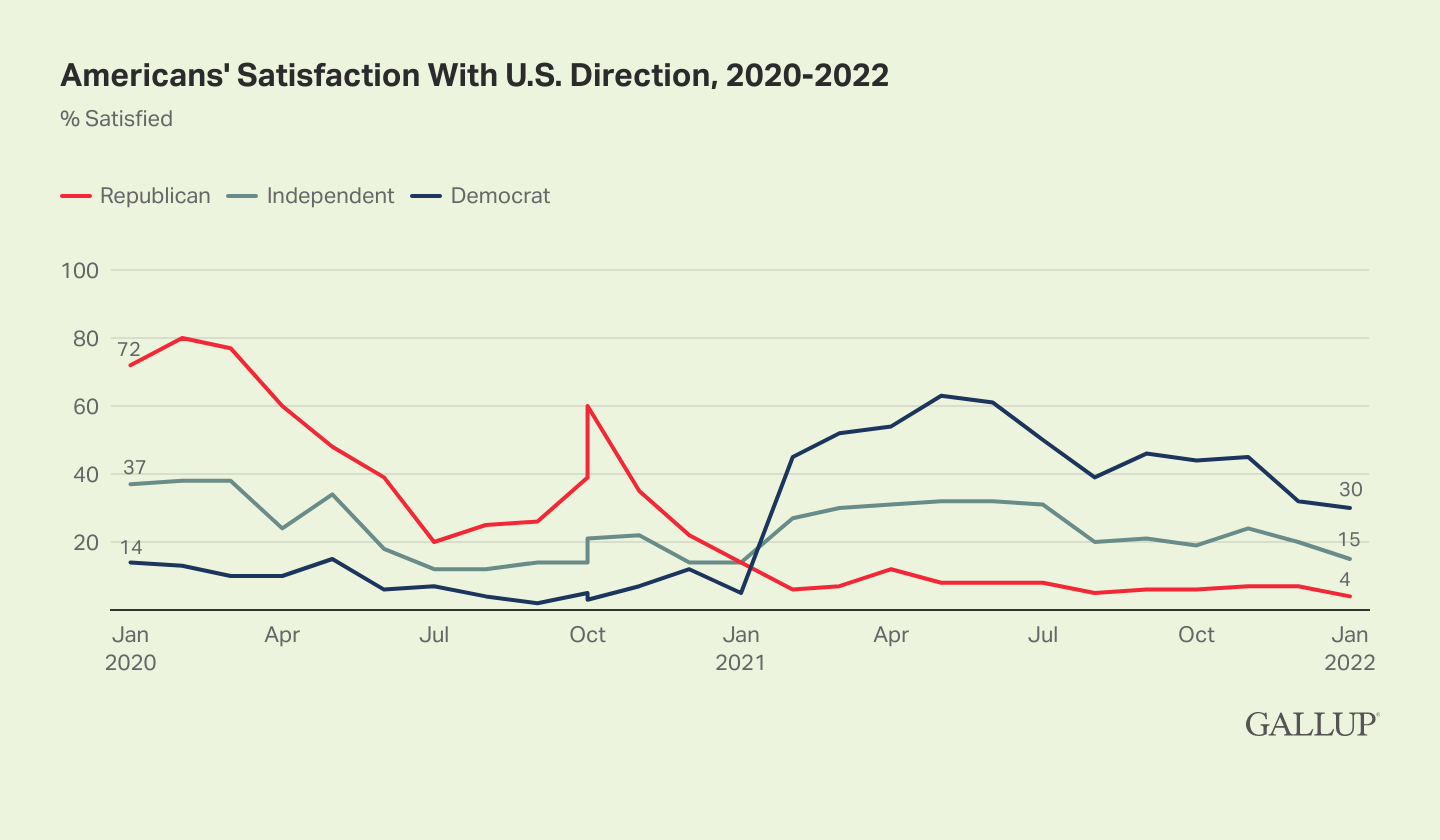
Line graph. Partisans' satisfaction with the way things are going in the U.S. since January 2020. Satisfaction is currently muted among all partisans, with 30% of Democrats, 15% of independents and 4% of Republicans saying they are satisfied. Republicans' satisfaction outpaced Democrats' during Trump's presidency, but once Biden took office, Democrats became more satisfied than Republicans. Democrats' satisfaction was higher last spring than it is now.
Bottom Line
Although most Americans are very dissatisfied with the way things are going in the U.S. right now, few express dissatisfaction with their own lives, suggesting that the problems they see in the nation don't directly affect them personally. Still, the reduced percentage continuing to feel very satisfied with their own lives suggests that the pandemic and its economic effects remain troubling to the public. Indeed, Americans' ratings of their own mental health are steady at a lower level, and their outlook for the nation's economy is bleak.
To stay up to date with the latest Gallup News insights and updates, follow us on Twitter.
Learn more about how the Gallup Poll Social Series works.